What is geospatial data? Collection, analysis, and how to use it
Updated:
Everything you need to know about geospatial data: what it is and how to turn it into decisions your team can act on.
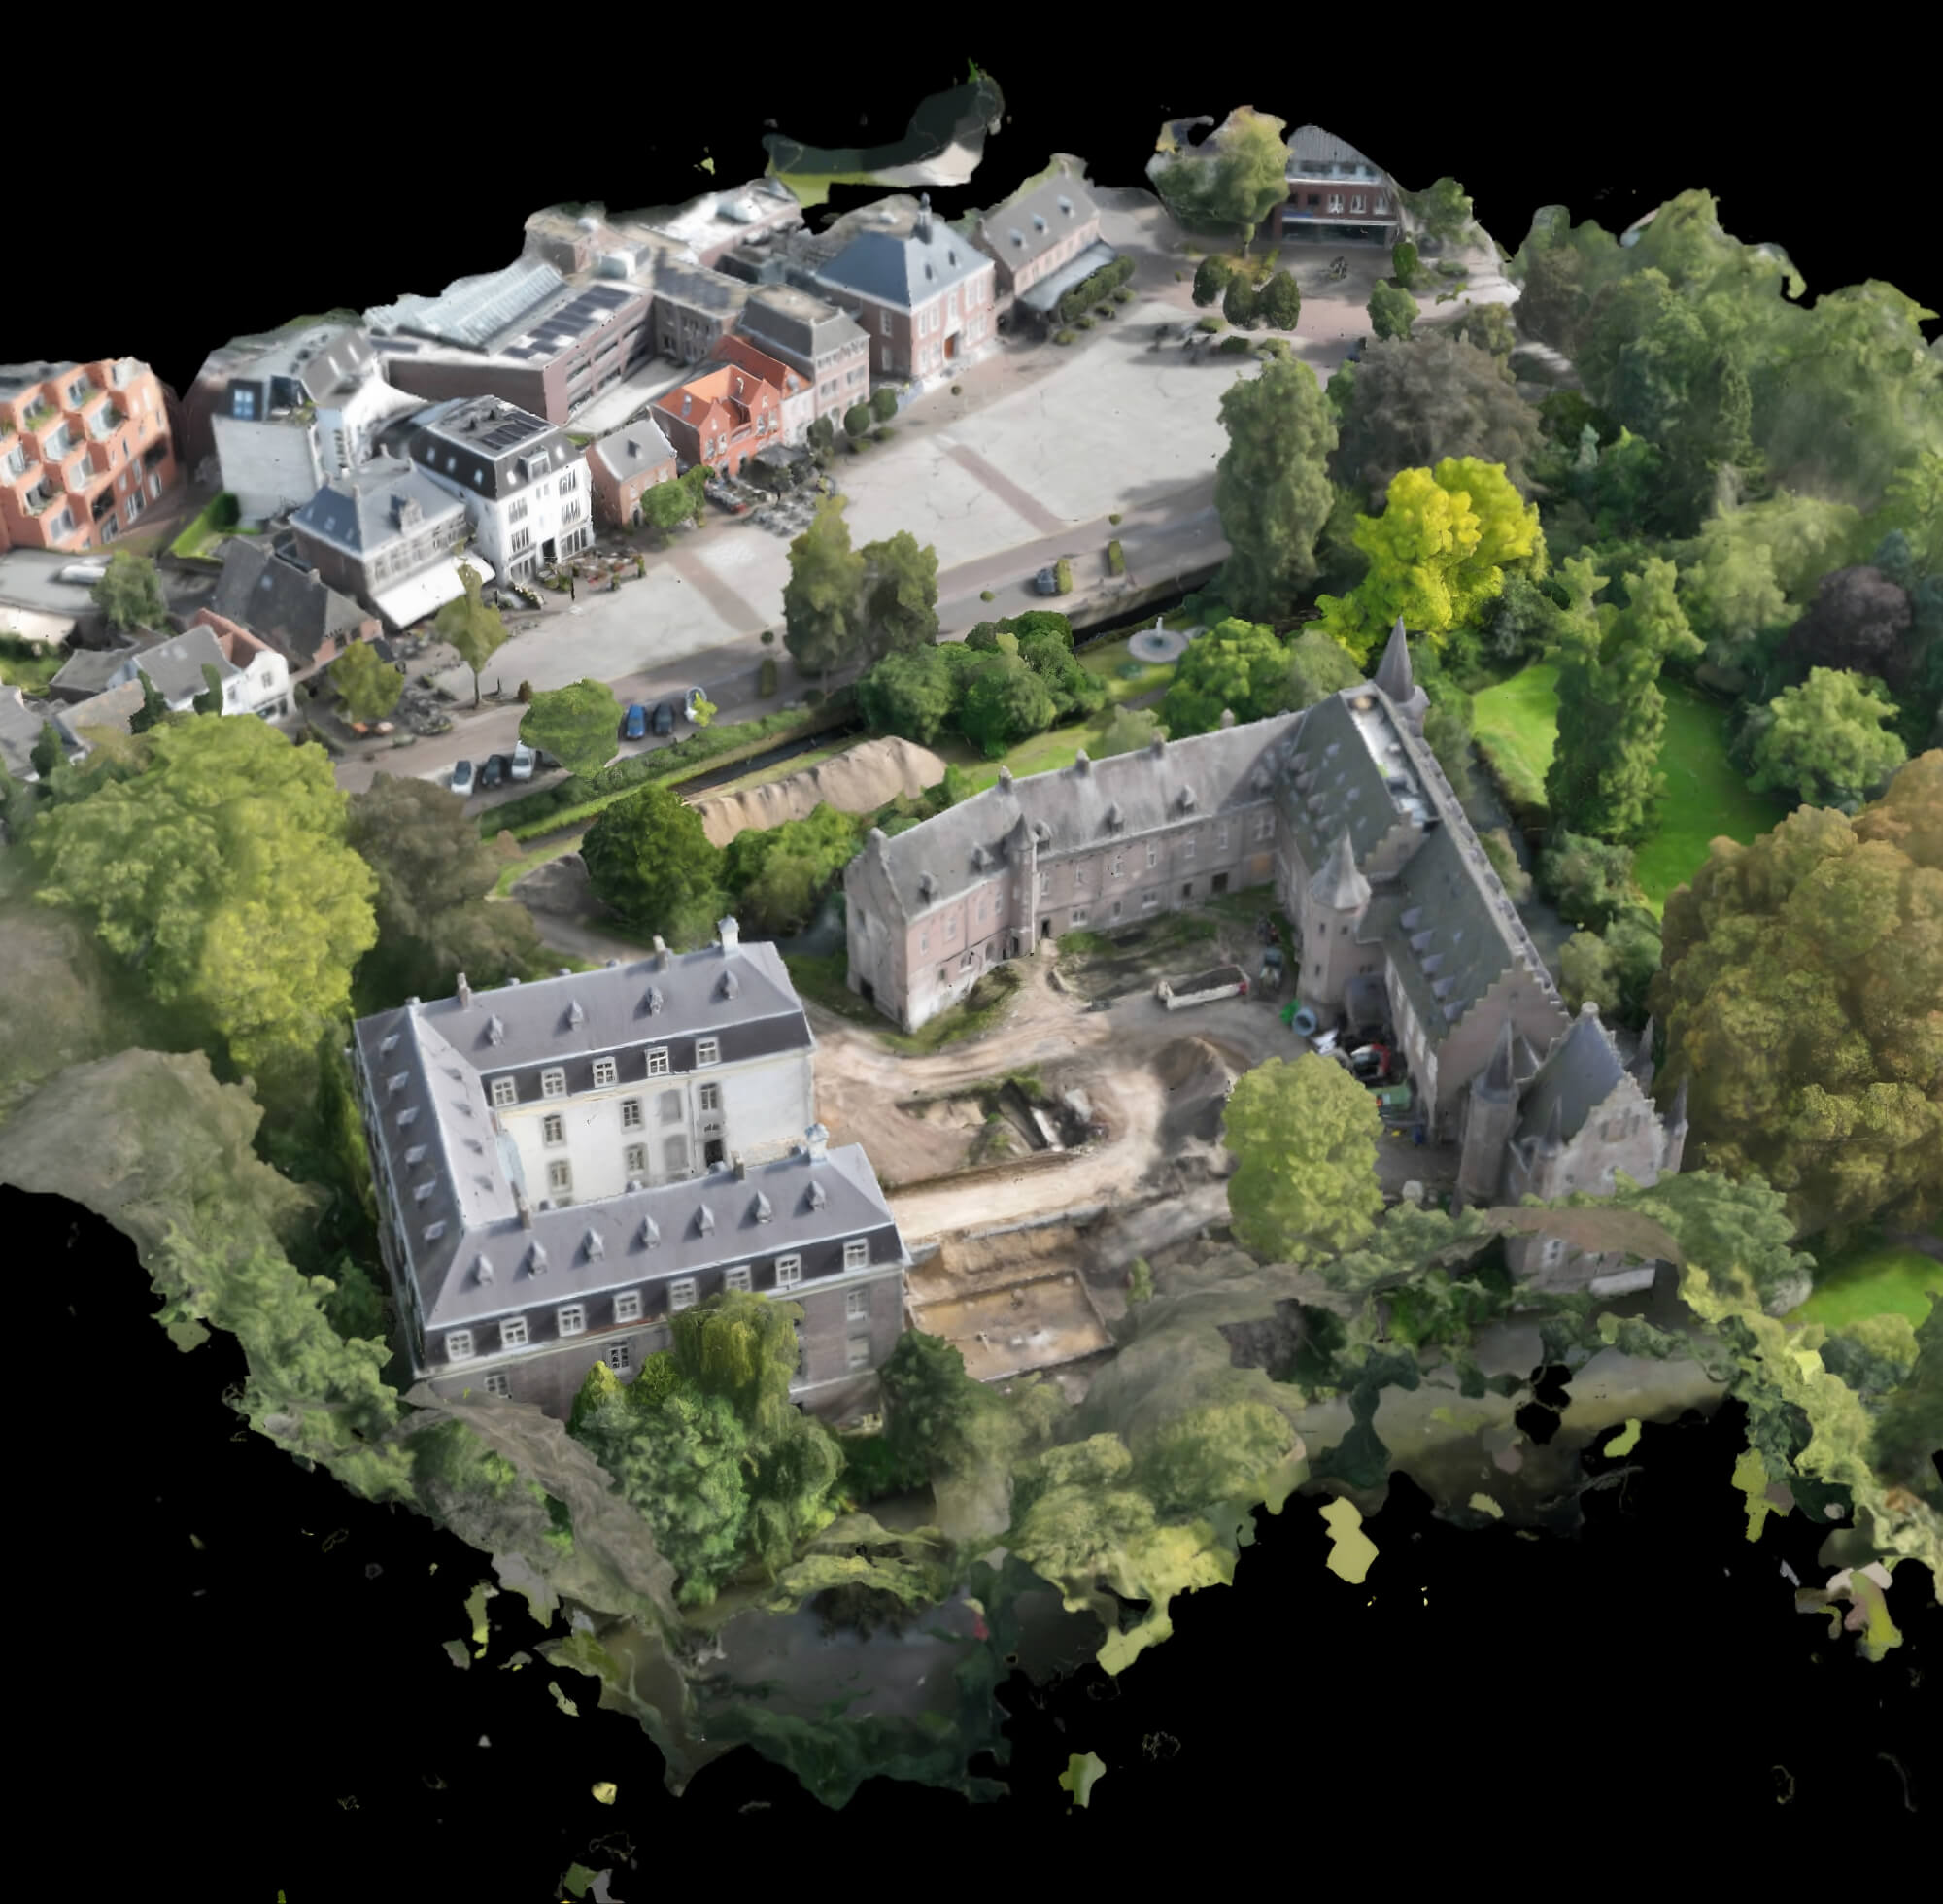
Every decision made on a construction site is a decision about location. Where to dig, and whether what’s already been moved still matches the plan. That’s geospatial data, and most teams are already working with it without calling it that.
This guide breaks down what geospatial data is, what makes it different from regular data, how it gets collected, how to analyze it, and, most importantly, how to use it to make faster, smarter decisions on the ground.
What is geospatial data?
Geospatial data is any information that has a location attached to it. It answers the question: where?
Definition: Geospatial data is any data that includes a location component (coordinates, elevation, or spatial geometry) that ties information to a specific place in the real world.
A temperature reading is just data. A temperature reading tied to GPS coordinates at a specific elevation on a construction site at a specific time is geospatial data.
In practice, geospatial data usually refers to two things working together. Spatial data is the geometric representation of a feature in the real world, such as a point, a line, a polygon, or a 3D surface. Attribute data is the descriptive information attached to that shape, such as volume, elevation, material type, or date of capture.
Together, they let you answer questions that regular spreadsheets simply can’t: How much earth was removed from this zone last week? Is the actual slope matching the design grade? Where exactly is the discrepancy between the contractor's reported quantities and what’s visible from the air?
What makes geospatial data unique?
Most data is just a table, rows and columns, no inherent relationship to the physical world. Geospatial data is fundamentally different in three ways.
It is location-aware. Every measurement exists in real space. You can overlay it with other spatial layers, like a CAD design, a cadastral map, or a WMS service, and immediately see the relationships and conflicts that would be invisible in a spreadsheet.
It is inherently multi-dimensional. A 2D orthophoto gives you the top-down picture. A point cloud or 3D model adds the Z axis: height, depth, volume. These layers together reveal what no single measurement can.
It degrades over time, which makes recency critical. A construction site changes daily. Geospatial data that is two weeks old can be actively misleading. This is why the ability to capture and process new data quickly isn’t a nice-to-have but the whole point.
According to MarketsandMarkets, the geospatial intelligence market is projected to grow from USD 37.13 billion in 2025 to USD 62.88 billion by 2030, a compound annual growth rate of 11.1%.
This uniqueness is also why traditional GIS software often feels like overkill for field teams. It was built for analysts working with static regional datasets, not for site managers who need answers before the morning standup.
Types of geospatial data: vector and raster
Geospatial data is stored in two primary models: raster and vector. Understanding the difference helps you choose the right format for the task and interpret what you see in platforms like AVAG.
Raster data is stored as a grid of pixel values, where each cell holds a measurement tied to a specific location. As Data Carpentry explains, this format works well for continuous phenomena that vary across space. In drone and construction workflows, common raster outputs include orthophotos (stitched aerial imagery), digital elevation models (DEMs) that represent terrain height at each pixel, and point-cloud-derived surfaces used for volume calculations. When you view a colorful top-down map of your site in AVAG, you’re looking at raster data.
Vector data represents features as discrete geometric objects: points, lines, and polygons. Each object carries attribute information, like an ID, a label, or a measurement. In AVAG, vectorized CAD layers, site boundaries, cross-section lines, and annotation markers are all vector data. Vectors are precise, scalable, and ideal for design overlays, boundary definitions, and any feature with a clear edge.
Most geospatial workflows combine both models. You might drape a vector CAD design over a raster orthophoto to check whether the as-built conditions match the plan, or draw vector cross-section lines on a raster elevation surface to extract terrain profiles. AVAG handles both formats natively, letting you layer, compare, and analyze without converting files or switching tools.
How is geospatial data collected?
There are several ways geospatial data gets collected, and they vary significantly in cost, accuracy, and speed.
Traditional surveying uses total stations, GNSS receivers, and leveling equipment. It’s accurate and legally defensible, but slow. A full site survey can take days, and the results are available to one person with specialized software.
Satellite imagery provides broad coverage at low cost, but resolution is limited and you’re dependent on weather windows and satellite pass schedules. You can see what something looks like from orbit; you can’t calculate earthwork volumes from it.
LiDAR scanning, either terrestrial or airborne, produces extremely dense point clouds. It’s powerful but expensive and typically requires specialist operators.
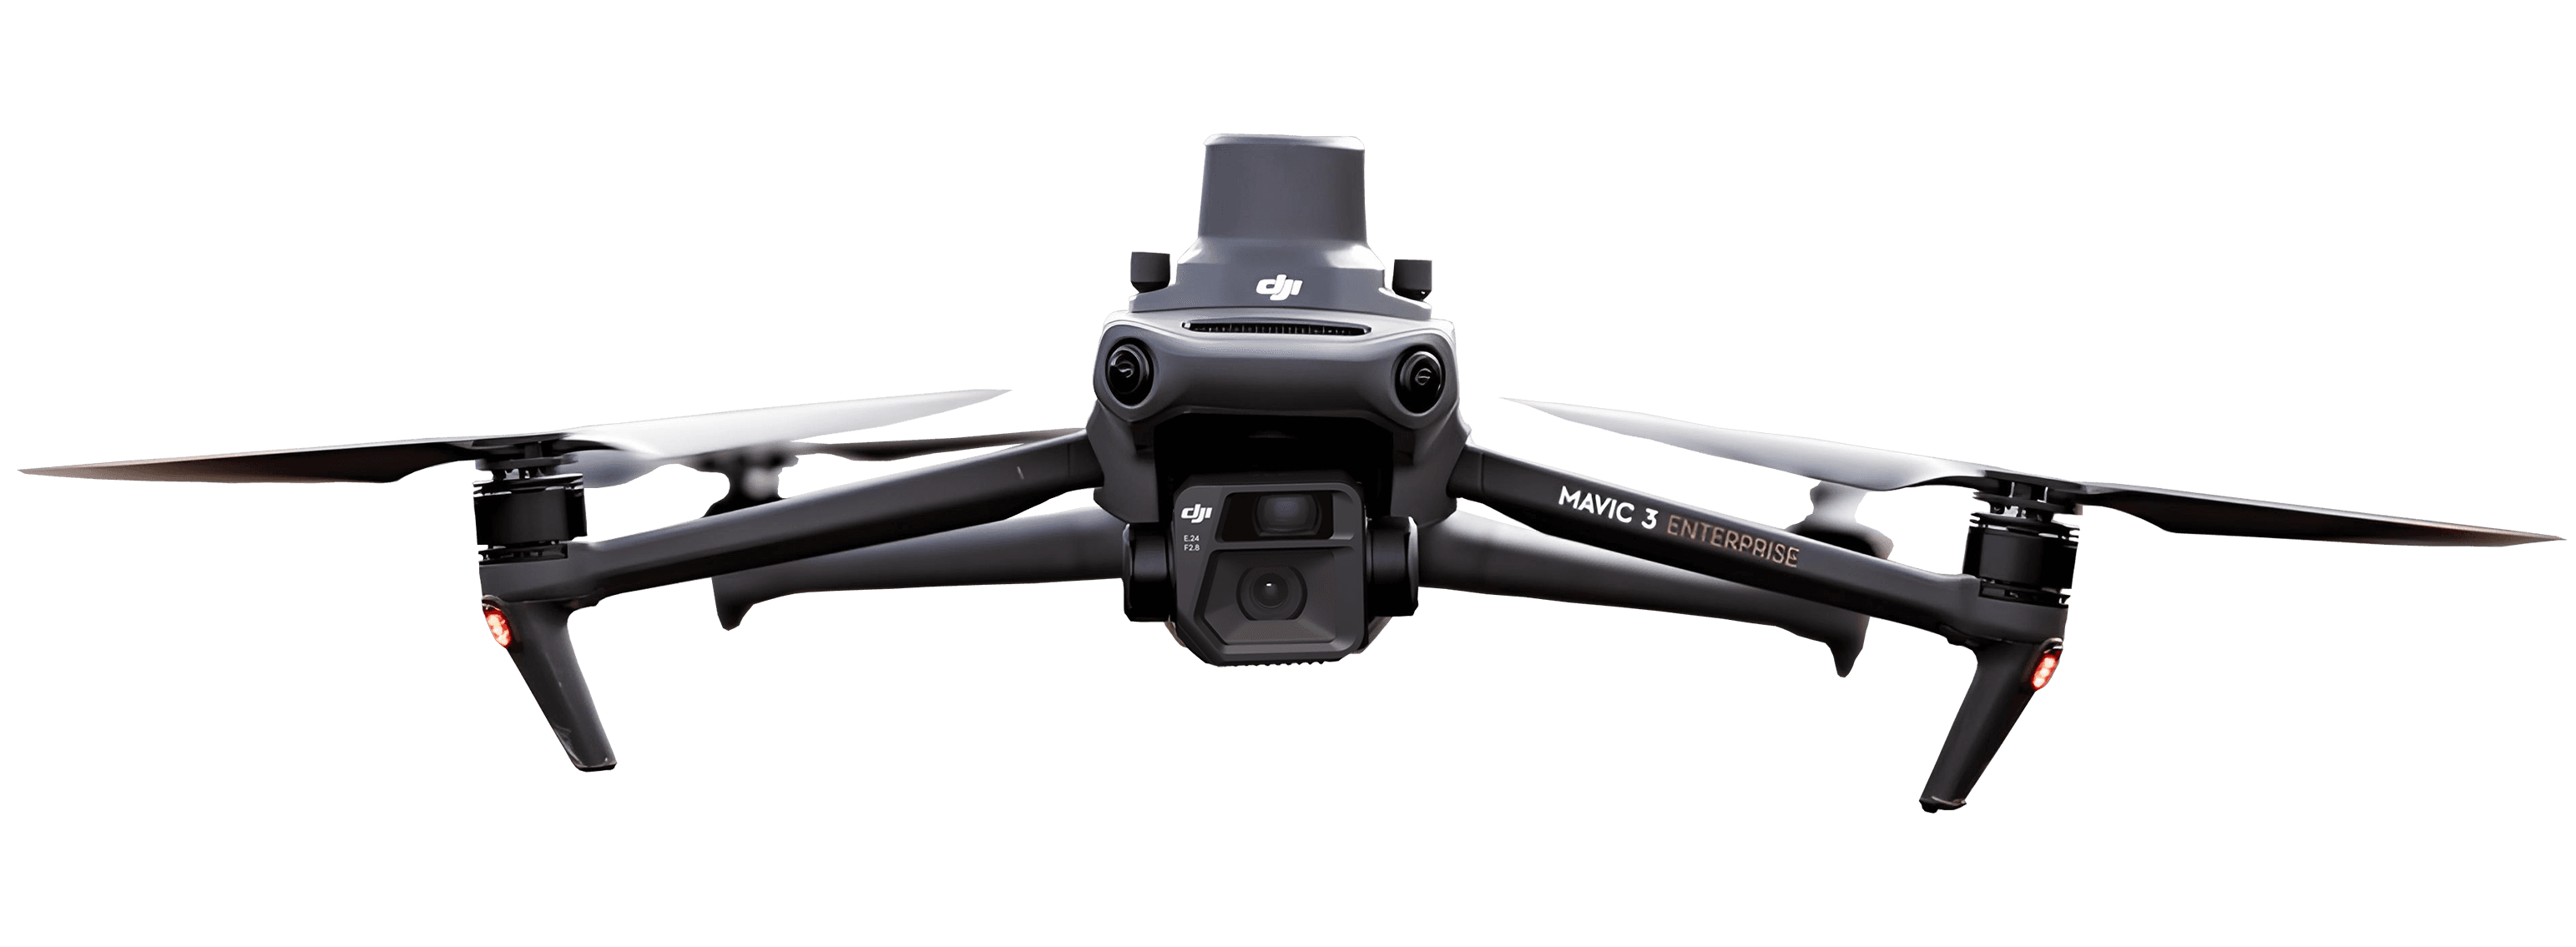
Drone photogrammetry has changed the calculus for most construction and earthworks teams. A drone can survey a site of several hectares in under an hour. The raw imagery is processed into orthophotos, point clouds, digital elevation models, and 3D meshes, which are all georeferenced and measurable. Costs have dropped dramatically, and the data quality is sufficient for volume calculations, progress tracking, and contractor verification at most sites. A 2024 peer-reviewed study in the journal Drones found that drone photogrammetry with well-distributed ground control points reached about 2.5 cm horizontal and 3.0 cm vertical accuracy (RMSE). Among the best drone data platforms, AVAG stands out for combining processing, visualization, and team-wide access in one place.
AVAG was built specifically around drone-captured geospatial data. We’ve flown thousands of construction site missions ourselves, so we know what the data needs to do once it lands.
Geospatial data analysis: From raw data to real decisions
Collecting the data is step one. Geospatial data analysis is where it becomes useful.
In construction and earthworks, geospatial data analysis means comparing what’s actually on site against what’s supposed to be there and turning that comparison into something you can invoice, report, or act on. In AVAG, that looks like:
Volume calculations. How much material has been moved? How much remains? Cut/fill analysis compares the current terrain surface against a design model and shows you exactly where you're ahead or behind plan in both 2D and 3D. Learn more about earthworks and construction solutions.
Terrain profiling and cross-sections. A cross-section through a road embankment shows the actual slope versus design. Run it in minutes, not days, and use it to verify contractor work before signing off on invoices.
Layer comparison. AVAG lets you compare up to four datasets simultaneously in a split-screen view: this week’s survey against last week’s, or the design grade against current conditions. No other platform offers this. It’s the difference between knowing something changed and knowing exactly what changed, where, and by how much.
Design compliance checks. Import your CAD drawings or design grade, then compare them to the current state of the site. Discrepancies are immediately visible in a layered 2D/3D view rather than buried in a comparison spreadsheet.
Traditional geospatial analysis required GIS software that took significant time to learn and expensive per-user licenses that locked results away from most of the team. AVAG was built to break that pattern: powerful analysis tools that both surveyors and site managers can use, accessible to your entire team without per-user costs.
How to get geospatial data for your projects
There are three practical routes, depending on where you are in your workflow.
Capture it yourself with a drone. If your team operates drones, you already have the collection side covered. Upload the raw imagery to AVAG and choose your processing workflow: fully automated (no GCPs needed, free), semi-automatic with expert verification for higher-accuracy GCP-based projects, or import outputs directly from other photogrammetry software like PIX4D, Agisoft, DroneDeploy, or 3DSurvey. If you’re evaluating tools, see our guide to choosing photogrammetry software.
Commission a drone service provider. Many construction companies partner with drone operators who handle capture and deliver processed data. If you’re the drone service provider, AVAG lets you give each client their own secure access so they can view results, generate reports, and confirm quantities without needing specialized GIS software or a license.
Import existing processed data. Already have outputs from a previous survey or another platform? AVAG accepts standard formats including DXF, TXT, CSV, Shapefile, and more. Your historical data doesn’t become stranded.
AVAG is used by teams in 80+ countries and trusted by companies including STRABAG, Vinci Construction, and Colas because it puts accurate geospatial data in front of the people who need to act on it.
How to actually use geospatial data
Geospatial data is only valuable when it changes behavior. Here’s what that looks like in practice.
Before the day’s work starts: A site manager opens AVAG, checks the latest orthophoto overlaid with the design grade, and briefs the machine operators on where they're running behind.
During invoicing: Instead of trusting the contractor’s reported quantities, the project manager runs a volume calculation in AVAG against the last drone flight. Discrepancies surface before the invoice is signed.
In a project meeting: The team pulls up the layered 2D/3D view and works through a problem together. Everyone in the room sees the same data.
For client reporting: Drone service providers generate and share invoice-ready reports directly from AVAG, giving clients a clear record of progress and confirmed quantities without complicated file transfers or specialized viewer software.
For long-range planning: Comparing weekly drone datasets shows the pace of earthworks and projects forward to predict when specific milestones will be reached or missed.
Why geospatial data might still feel complicated and how that changes
The gap between what geospatial data can do and what most teams actually use it for comes down to tooling. Legacy GIS platforms were designed for specialist analysts, not site managers. They require training, expensive licenses, and complex local setups. Results stay siloed with the person who has the software.
AVAG was built to close that gap. The platform handles the technical complexity of photogrammetric processing, stores data securely, and puts the outputs like orthophotos, point clouds, 3D models, volume calculations, and terrain profiles in a cloud interface that every member of your team can access, from the site office or from headquarters, , with unlimited-user pricing.
It’s why a senior specialist described AVAG as “much simpler than having users learn GIS software.” And why a quantity surveyor uses it to let clients directly follow projects and confirm compliance.
Geospatial data doesn't have to be complicated. It just needs the right home.
What is an example of geospatial data?
What are the two types of geospatial data?
What is the difference between GIS and geospatial data?
Is GPS geospatial data?
See what your geospatial data can really do
Join more than 1,000 satisfied users. Just upload your files and see results.
No credit card required
About the author

Zaneta Styblova
Content Lead at AVAG Pro
Zaneta Styblova is a content professional with over eight years of experience in content marketing. She crafts impactful content that resonates with global audiences, drawing on a strong background in linguistics and a deep understanding of how language, structure, and tone shape effective communication.
Subscribe and do not miss latest posts
Blog
Explore more articles