A new look. A clearer view of your site.
Updated:
Your site keeps changing and so does AVAG. Check out the new interface and improvements.

A survey captures a site at a particular moment. Its value grows when people can use it to understand what has changed and decide what happens next.
That is the focus of our latest AVAG release.
We have redesigned the workspace and introduced new ways to explore, measure, and compare data. Together, these changes make it easier to move from a broad view of a project to the detail behind a measurement.
The first thing you will notice is the new interface. But the release goes beyond appearance. It reflects how we want AVAG to support your work: keeping data accessible while making comparisons easier and giving you useful tools where you need them.
A workspace that is easier to navigate
A construction project brings together different kinds of information: surveys captured on different dates, design surfaces, measurements, field photos, and observations from colleagues.
As that information grows, finding the right dataset or tool becomes part of the work itself.
The updated AVAG workspace gives these elements a clearer structure. The sidebar organizes data sources, project information, and analysis tools. The top bar brings together frequently used controls, including Import, Export, Measurements, Labels, and Panes.

Detail panels let you work with layers and selected measurements alongside the map. You can find a dataset, adjust what is visible, and inspect its properties while keeping the site in view.
The aim is straightforward: make navigation familiar enough that you can concentrate on your project.
Different views, together
A single view rarely answers every question.
An orthophoto gives you an overview of the site. A point cloud helps you inspect its shape. A panorama adds ground-level context. An earlier survey shows how things looked before the latest work.
With panes, you can arrange those perspectives alongside one another. Compare surveys from different dates, place a 2D map beside a 3D view, or keep inspection imagery open while reviewing the wider site.
You can drag a dataset from the Layers panel into a pane and choose the view that suits the task.
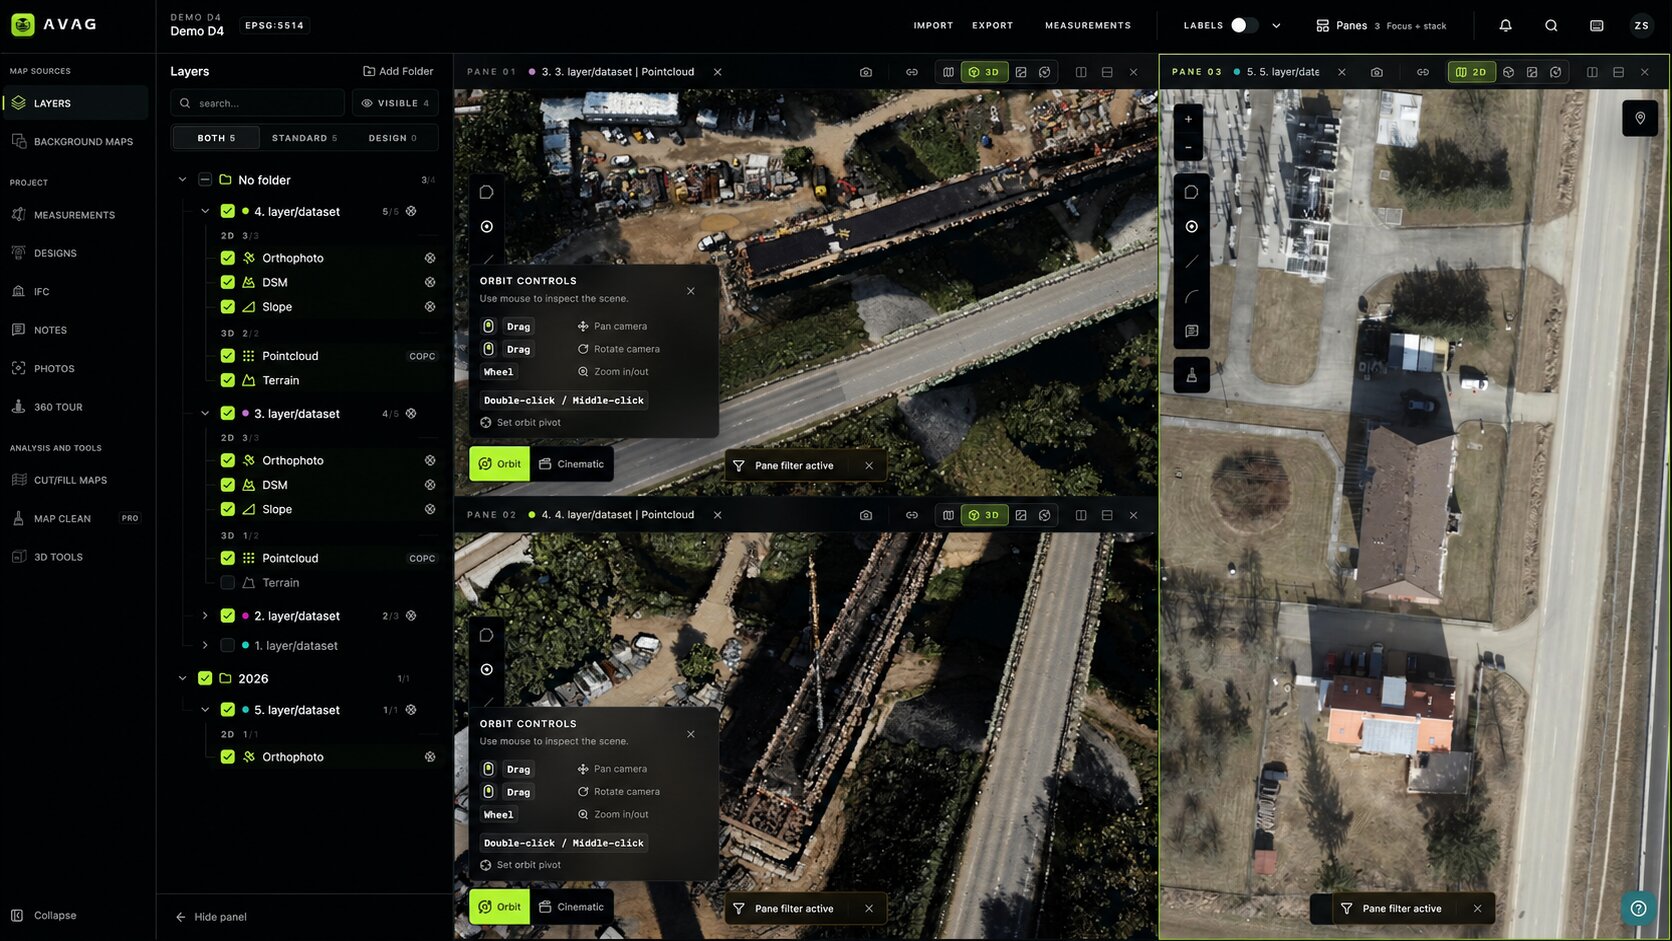
For a project manager, that might mean reviewing progress between two surveys. For a surveyor, it might mean examining a design surface alongside one of two panes of measured data. For a colleague working remotely, an aerial view beside a panorama can make a location much easier to understand.
Keeping those views together helps people explain what they see and ask more precise questions.
Meet Arc: measure beyond straight lines
Some of the most useful product improvements begin with a specific customer request.
Arc is one of them.
Roads curve. So do access routes, boundaries, and many of the features people need to measure on a construction site. Our customers asked for a way to work more naturally with those shapes.
The new Arc tool lets you draw a curved measurement path directly in AVAG. Once created, an arc appears alongside your lines in the Measurements panel, where you can inspect its length, 3D length, and elevation extremes.
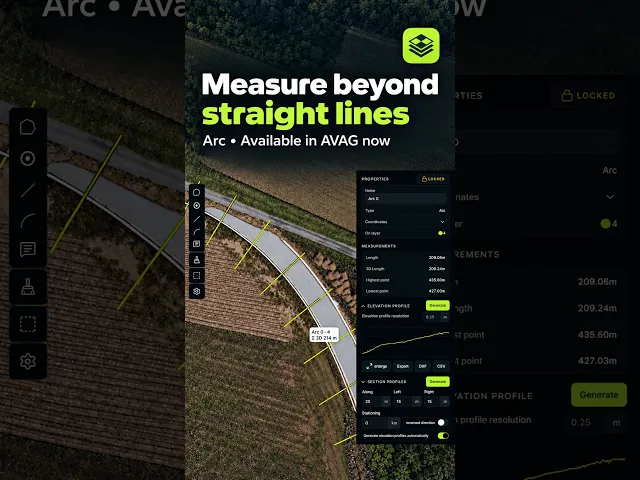
You can also generate an elevation profile along the arc or create a series of cross-sections across it.
That makes Arc useful beyond drawing a curve on a map. It provides a path for investigating the surface along a bend and examining how the surrounding terrain changes.
A curved road section, for example, can become the basis for both a longitudinal profile and regularly spaced cross-sections. You can review those results in AVAG and export profile data for further work.
It is a focused addition, shaped by a practical need—and that is exactly the kind of customer feedback we want to keep building on.
Check out Terrain: Another way to understand the surface
This release also introduces Terrain, a new way to explore an elevation surface in the 3D workspace.
Terrain gives you a continuous view of the site’s surface. You can display it with orthophoto imagery or use elevation, slope, and aspect coloring to examine different characteristics of the ground.
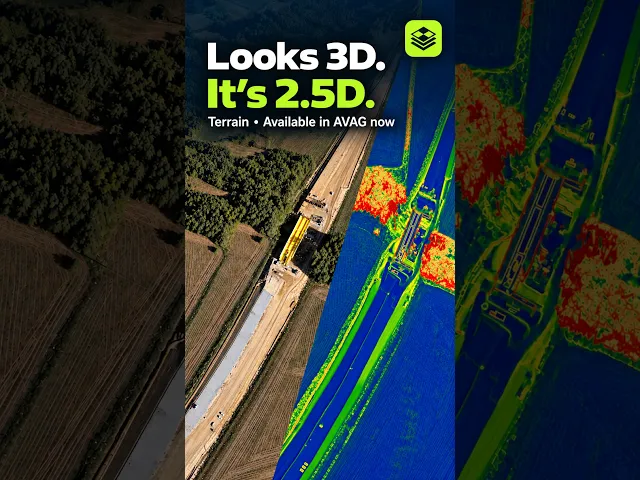
Each view helps answer a different question:
Elevation makes height differences easier to see.
Slope highlights changes in steepness.
Aspect shows the direction slopes face.
Contour lines help you read the shape of the surface.
These options give you more ways to investigate a site before moving into a detailed measurement or discussion.
Why we call it 2.5D
Terrain looks three-dimensional, but it represents one elevation for each horizontal position. This is commonly described as 2.5D.
That distinction matters.
A single elevation surface can describe hills, valleys, and slopes. It cannot represent both a bridge and the ground beneath it at the same horizontal location, or fully describe an overhang or a cave.
For those situations, you need suitable full 3D data, such as a point cloud.
Terrain adds another useful perspective to your workspace. The right view depends on the feature you are examining and the question you need to answer.
More control over your 3D view
Working with 3D data should feel comfortable on the device you use every day.
The updated display settings let you balance visual detail and navigation performance. You can choose a quality preset, adjust point cloud appearance, and control Terrain coloring, contours, and surface detail.

These settings change how the data is displayed without modifying your source files.
We have also brought Orbit and Cinematic navigation controls into the workspace. Orbit helps you inspect a feature from different angles. Cinematic lets you move through the scene, with controls for movement speed, rotation speed, and camera smoothing.
That flexibility is useful when you are examining a site yourself—and when you are walking someone else through it.
Keep observations close to the data
A measurement becomes more useful when people understand its context.
What does this boundary represent? Why was this location marked? Which feature needs another look?
Notes let you place that context directly in the view. Alongside measurements and inspection photos, they help turn a dataset into a shared record of what your team has observed.

The updated organization of layers and measurements also makes it easier to keep growing projects manageable. Search, folders, and visibility controls help you focus on the information relevant to the task in front of you.
These are small interactions, but they are repeated throughout the day. Making them clearer is an important part of making AVAG more useful.
Take a look around
A redesigned interface takes a little getting used to, even when the changes are intended to make things easier.
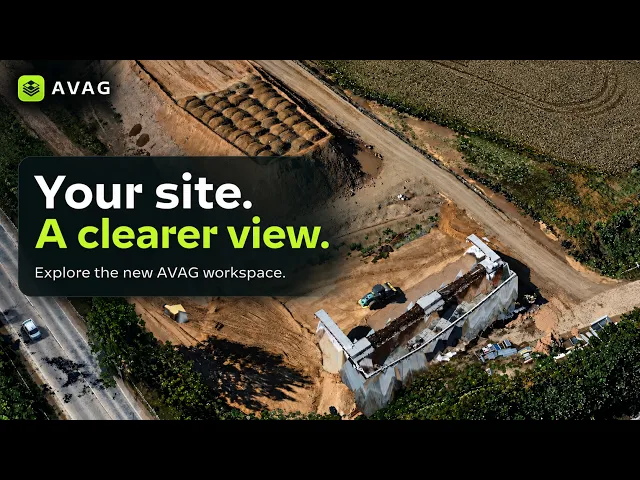
We have prepared a short walkthrough to show you where everything lives. The updated AVAG Help Center also provides step-by-step guidance for the new workspace and its tools.
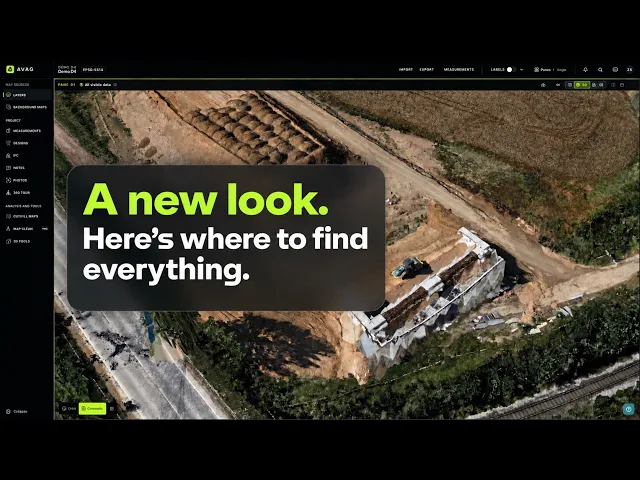
I would encourage you to open a familiar project first. Compare two surveys, try an arc along a curved feature, and explore the same area in Terrain and Point cloud views.
Your own site is the best place to see what the update makes possible.
And please keep sharing your feedback. Arc is a good example of how a concrete request can become a useful addition to the product. We want to hear which tasks are getting easier—and where you still need us to improve.
See what your geospatial data can really do
Join more than 1,000 satisfied users. Just upload your files and see results.
No credit card required
About the author

Miroslav Staubr
CEO at AVAG Pro
Miroslav Staubr is the CEO and co-owner of AirView s.r.o. and the product lead behind AVAG, a cloud platform used across construction and surveying for processing drone, LiDAR, and 3D geospatial data. As a certified drone pilot with the highest permit for aerial mapping, he brings hands-on experience working with UAVs (Unmanned Aerial Vehicles), commonly known as drones, to capture precise data for photogrammetry, terrain analysis, and earthwork volume calculations.
Subscribe and do not miss latest posts
Blog
Explore more articles

Integrating drone data with CAD drawings for site analysis
Why wait days for a surveyor when your drone can update the site plan by afternoon?
Read more

What does “photogrammetrically” mean? A plain explainer
Learn what “photogrammetrically” means and how photos become accurate 3D site measurements.
Read more